

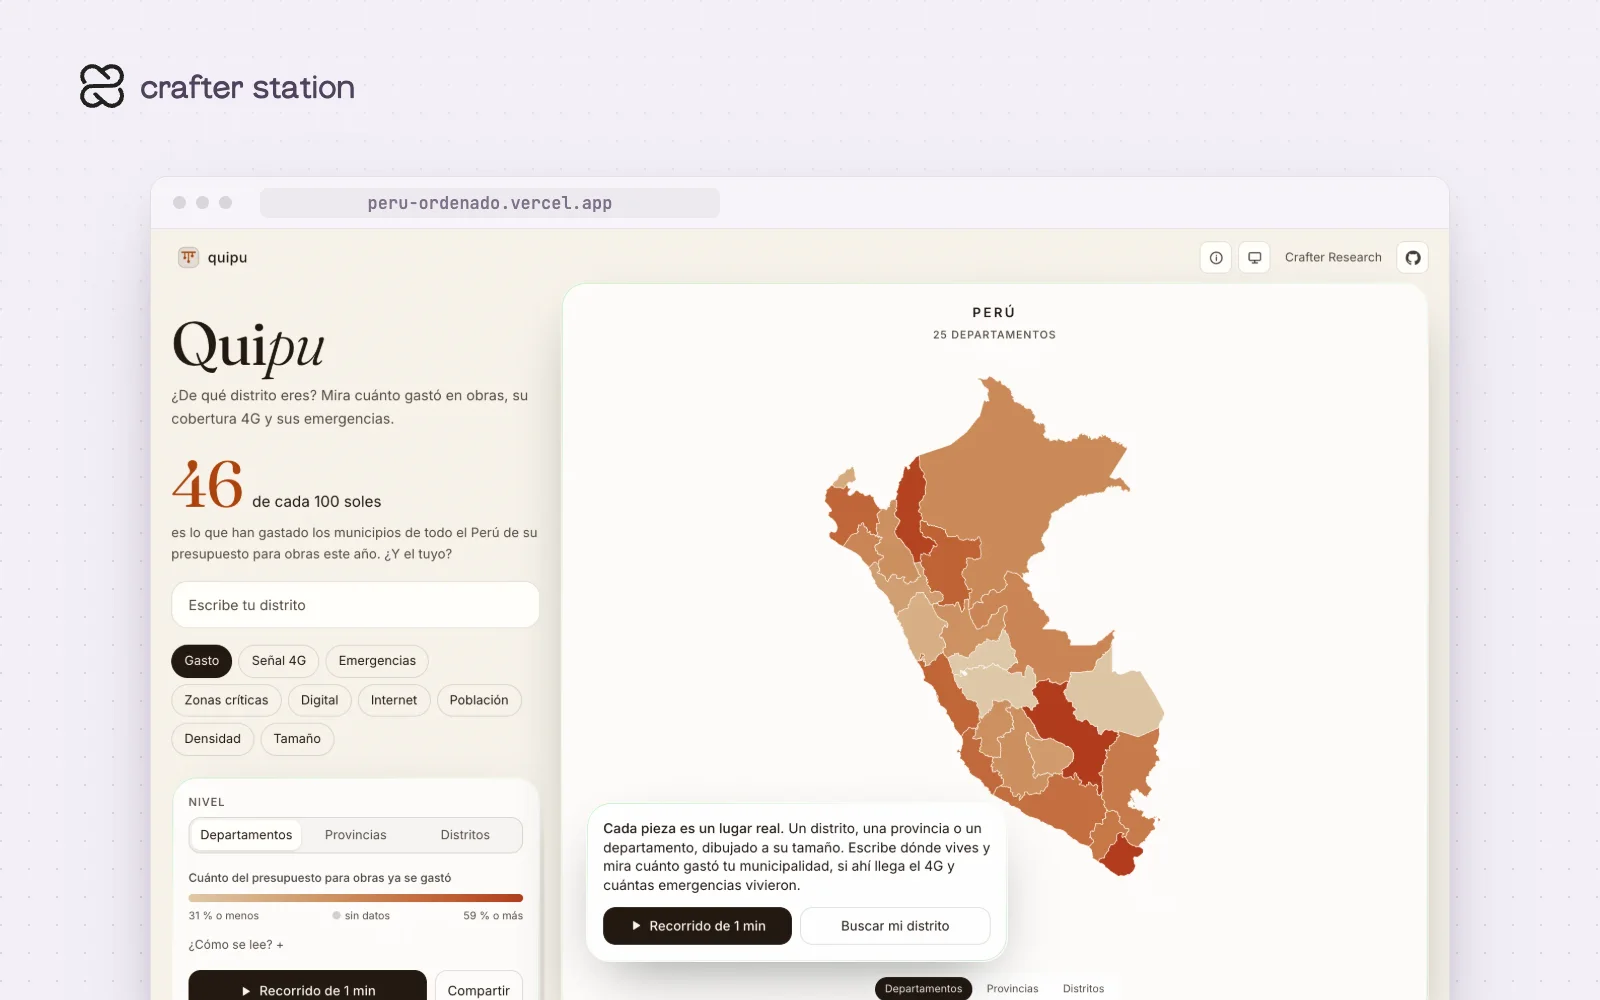
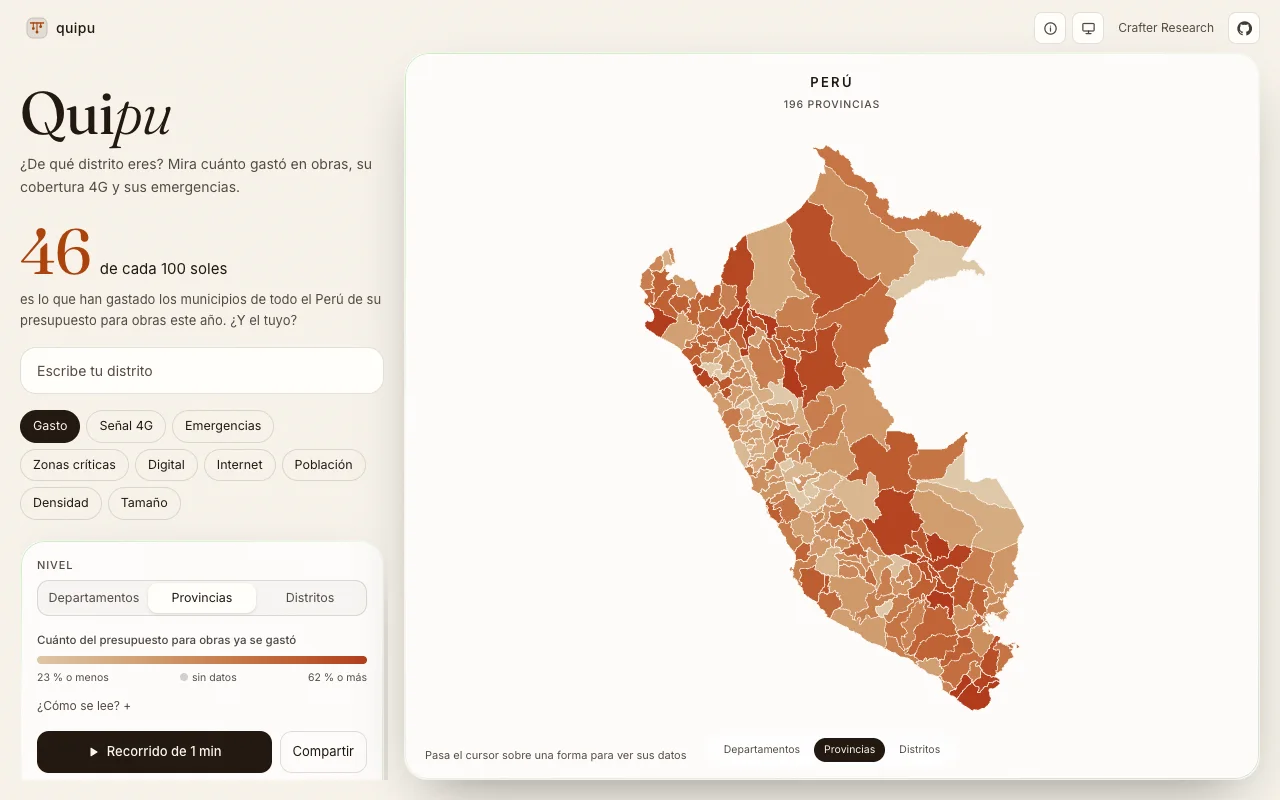
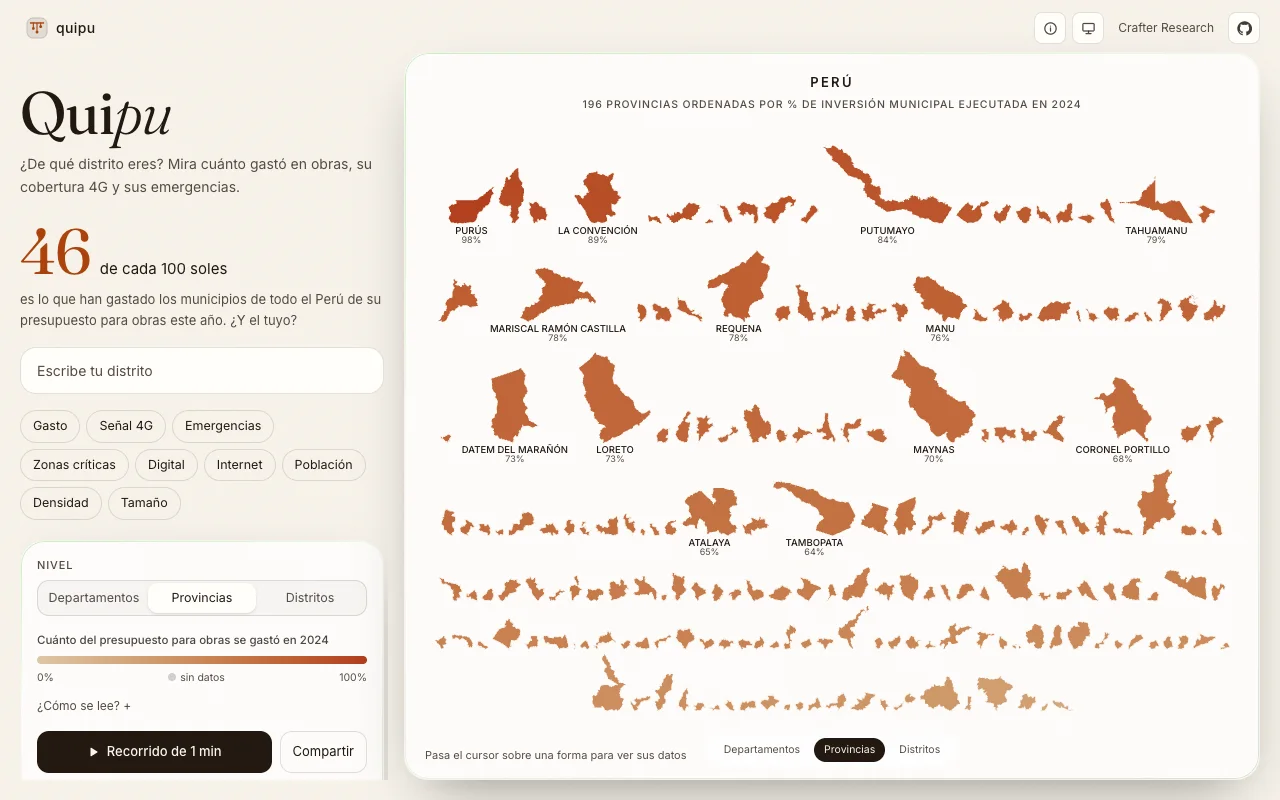
This map of Peru takes every department, province and district out of its place and lines them up in rows at true relative scale, sorted by the metric you pick. It is for anyone who wants to see how much their municipality spent on public works, and where 4G coverage and emergencies land. The site now goes by Quipu. Open it at peru-ordenado.vercel.app.
From 25 departments to 1,873 districts#
Switch between departments, provinces and districts. Going down, each region's children fly out of their parent, and going up they fold back in. You can limit every level to one department, and the whole state lives in the URL, so any view can be shared.
Sorted by what you care about#
Metrics include area, the local-government investment budget, how much of it was executed, 4G coverage, emergency decrees, critical zones, digital presence, population and density. Pick one and every shape lines up in rows from highest to lowest, with the leaders labeled.
Try it#
Open peru-ordenado.vercel.app, type your district, or press the one-minute tour. To run it locally:
git clone https://github.com/crafter-research/peru-ordenado.git
cd peru-ordenado
bun install
bun dev
What it includes#
- An eight-step guided story with captions computed from the data
- Boundaries from IGN, spending from MEF open data, population from the INEI 2025 census
- Missing values stay missing, nothing is filled in by rule
- An unofficial prototype from Crafter Research, inspired by "Taxonomía territorial del Perú" by Cristian Yarasca