
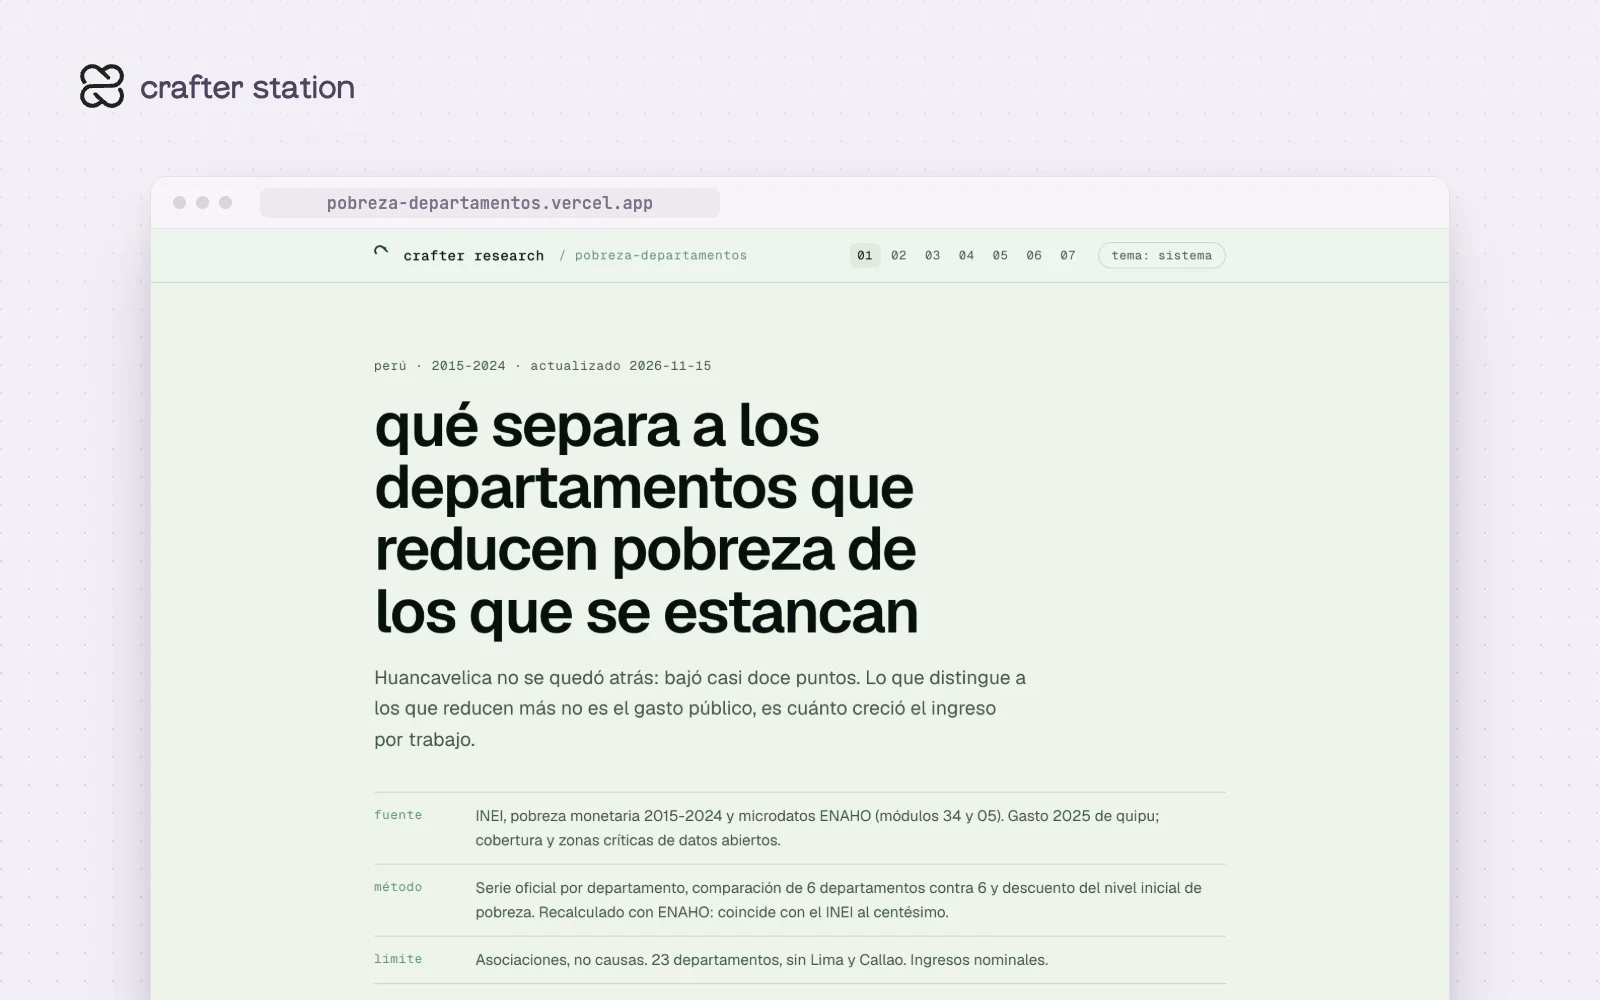
pobreza-departamentos compares how monetary poverty changed in 23 Peruvian departments between 2015 and 2024, using official INEI figures and ENAHO microdata. Huancavelica went from 45.2% to 33.4%, the third-largest drop in the country. The departments that cut poverty the most saw income from work grow faster, while public spending shows no clear link. The report is in Spanish. Read it at pobreza-departamentos.vercel.app.
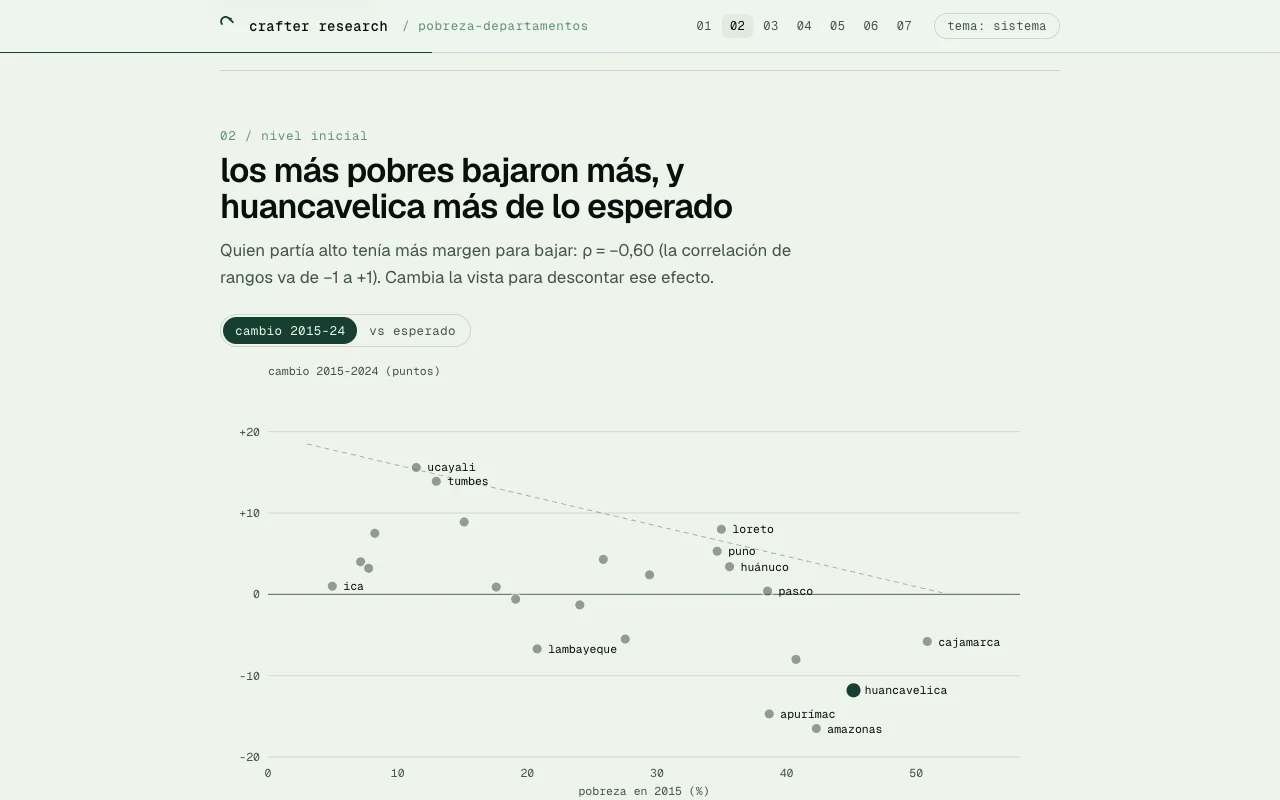
Poorer departments fell further#
Departments that started with more poverty had more room to fall, with a rank correlation of −0.60. The report lets you switch to the change against that expected trend, and Huancavelica still fell more than its starting level predicts.
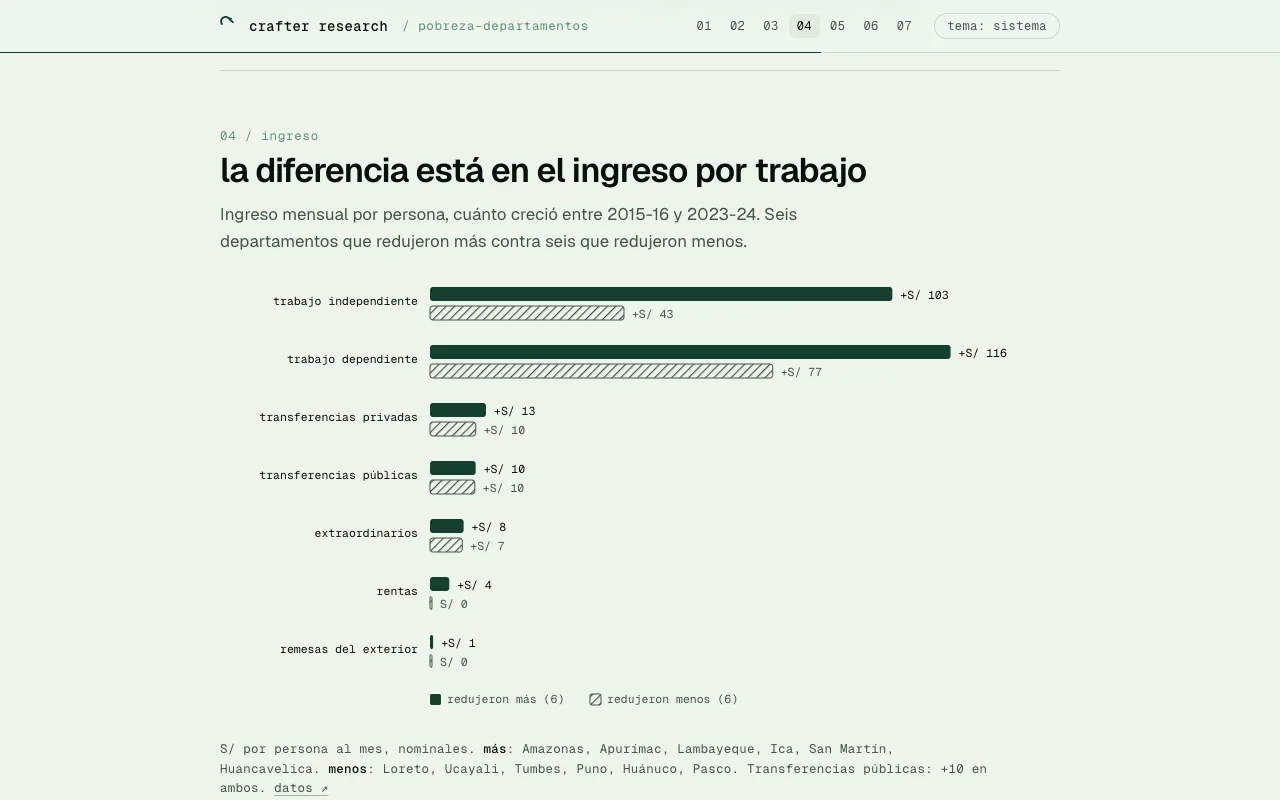
Income from work makes the difference#
The report tests eleven spending, service and territory factors, and none clears the noise band once the starting level is taken into account. The gap shows up in monthly income per person instead. In the six departments that cut poverty most, self-employment income grew by S/ 103 against S/ 43 in the six that cut it least. Public transfers grew by S/ 10 in both groups.
What it does not claim#
These are associations between 6 and 6 departments, not causes. Lima Metropolitana, Lima provinces and Callao are left out, incomes are nominal and the spending data is from 2025. The poverty rate recalculated from ENAHO matches the official INEI figure to the hundredth.
Try it#
Open the report and jump between its seven sections from the top bar. Every chart links to its data. To rebuild it, clone the repository and follow the README, which lists the scripts in order and where to download the ENAHO microdata.
git clone https://github.com/crafter-research/pobreza-departamentosSources#
- INEI, Evolución de la pobreza monetaria 2015-2024, statistical annex
- ENAHO 2015-2024, modules 34 and 05, from INEI microdata
- 2025 public spending from quipu, plus open data from OSIPTEL, INGEMMET and PCM
It is a working report without external review.